

3 Stage Nightly Routine and 5 Input Injury Lens for NBA Props Bettors

Price minutes first, then usage and efficiency, and bet the gaps where your number and the market’s number differ by a full point or more. Tonight, do three things: pull the official injury report, build a minutes-adjusted projection for your top targets, and shop that number across multiple books before staking small and scaling only once the edge repeats.
TL;DR:
- Project minutes first, especially from recent games with similar rest, to better capture role changes and avoid skewed averages from blowouts or load management.
- Official injury reports are now more reliable for betting decisions, with “out” tags within three hours of tip-off offering nearly final information.
- Thinner markets like rebounds and blocks require a larger projected gap over the market line to justify betting, due to wider margins and less sharp action.
- Combining correlated props into same-game parlays without understanding covariance often overstates true edge, so analyze historical usage and shooting patterns before stacking.
- Using a disciplined five-input routine and real-time odds comparison tools like Parlaygeeks helps rapidly identify and act on genuine market inefficiencies.
Table of Contents
- Core Framework: The Five-Input Projection Loop
- How to Forecast Minutes and Catch Role Volatility
- What the NBA Player Participation Policy Means for Bettors
- Line Shopping and Tracking Closing-Line Value
- A Three-Block Nightly Routine That Captures Real Edges
- Turning Projections Into Numbers: Formulas and Thresholds
- Covariance, Same-Game Parlays, and Market Traps
- Tools and Data Sources Worth Trusting
- Beating Your Own Brain: Bias Traps in Prop Betting
- Where Machine Learning Fits Into Prop Projections
- Points, Rebounds, and Assists Each Need Their Own Approach
- How Blowouts and Close Games Change Prop Outcomes
- Reading Public Betting Trends Without Following Them Blindly
- Adjusting Player Props in Real Time During Games
- How Roy Applies This Routine Across a Full Season
- Run This Routine Faster With Parlaygeeks
- Sources
- FAQ
Core Framework: The Five-Input Projection Loop
Every sharp prop projection runs through the same five filters in the same order: minutes, usage, efficiency, matchup, and pace. Skip the order and you’ll anchor on the wrong number before you even get to the parts that actually separate winners from public money.
Here’s why sequence matters. Minutes set the ceiling on everything else. A player can’t produce 25 points in 22 minutes no matter how hot his shooting has been. Usage tells you how much of that time gets spent creating offense versus standing in a corner. Efficiency (true shooting or effective field goal percentage) converts opportunity into production. Matchup and pace adjust that baseline up or down based on who’s guarding him and how many possessions the game will actually have.
- Minutes — project a weighted average from recent games, favoring outings with a similar rest profile.
- Usage rate — check for role changes triggered by injuries, trades, or a coach’s rotation shuffle.
- Efficiency (TS%/eFG%) — layer in the player’s shooting profile against the specific defense he’s facing.
- Matchup — adjust for the opposing team’s positional defense and pace tendencies.
- Pace — scale the whole projection to the expected number of possessions in the game.
Run both scenarios and the delta alone often exceeds the sportsbook’s number.
The actionable rule is simple: if your projection clears the market line by roughly a full point-equivalent (translated into probability terms for that market’s typical vig), it’s worth a stake. If the gap is smaller than the market’s usual noise band, pass. Weighting trailing windows correctly is what keeps this from becoming guesswork. Practitioner models built around this exact five-input loop treat minutes as the dominant variable precisely because every other input compounds off of it.

How to Forecast Minutes and Catch Role Volatility
Minutes are the single most volatile and most predictable input on the board, and that combination is what makes them so valuable. Volatile because coaches change rotations game to game. Predictable because those changes follow patterns you can track.
Start by charting a player’s minutes over his last 20 games rather than a season-long average, which smooths over exactly the trend you’re trying to catch. A coach who’s been quietly trimming a veteran’s minutes over six weeks isn’t going to reverse that pattern because Vegas set a line assuming his April numbers.
Back-to-backs, blowouts, and load management all distort the sample in specific, learnable ways:
- Players over 30 on the second night of a back-to-back tend to see a moderate reduction in minutes, which can be more substantial if the first game went to overtime.
- Blowouts (15+ point margins by the third quarter) pull starters early and inflate bench minutes, which skews recent averages if you don’t filter for game script.
- A recent DNP or minutes restriction due to injury management should reset your baseline rather than just discount it.
- Bench-to-starter transitions after an injury to a teammate often take one or two games to stabilize as the coach settles on a new rotation.
Pro Tip: Weight games with a matching rest profile more heavily than raw recency. A player’s last game on similar rest tells you more than his last game overall.
Quick checklist before locking a minutes number: confirm no new injury designation, check the schedule for back-to-back status, verify no recent blowout skewed the sample, and check for any reported rotation change from beat reporters covering that specific team.
What the NBA Player Participation Policy Means for Bettors
The NBA Player Participation Policy tightened how teams report and justify player unavailability, and that matters more to prop bettors than most casual bettors realize. Before the policy, informal “load management” patterns were often the best signal available. Now, official daily injury reports carry real investigatory weight behind them, which makes them a more decisive source than historical guesswork about which stars sit which nights.
That shifts how you should treat designations as tip-off approaches:
- A confirmed “out” inside three hours of tip is close to final. Act on it.
- A “questionable” tag is genuinely uncertain. Treat it as a probability, not a coin flip weighted toward playing.
- Late scratches (within 60 to 90 minutes of tip) create the sharpest line movement and the shortest window to react.
- Multiple games of “questionable” followed by a DNP is a pattern worth flagging for the next matchup too.
Injury-risk forecasting adds a layer most bettors skip entirely. A machine-learning study analyzing box-score data found that change in minutes since the last game, recent average minutes, days since last injury, and rest status are the strongest predictors of next-game injury risk.
Translated into a stat you can actually use: when a player’s minutes have spiked or dropped sharply over his last two or three appearances, his short-term injury probability rises measurably, which should push you toward a more conservative minutes projection for him and a more generous one for his likely replacement.
The practical rule: act immediately on confirmed news, but wait on ambiguous “questionable” tags until you’re inside that final pregame window, when teams typically firm up their intentions.
Line Shopping and Tracking Closing-Line Value
Props carry wider margins and far more variance between books than mainline spreads and totals, which is exactly why line shopping matters more here than almost anywhere else in sports betting. A rebounds prop that reads 7.5 at one book and 8.5 at another isn’t a rare occurrence. It happens constantly, because thinner markets like rebounds and blocks get less sharp action to correct pricing errors.
Closing-line value, or CLV, is the metric that tells you whether you’re actually finding edge or just getting lucky. If you consistently bet numbers that move in your favor by the time the game tips, you’re beating the market’s information, regardless of whether any single bet wins. Tracking CLV by market type often reveals that a bettor’s real edge lives in one specific category, like assists or three-pointers made, while another category is closer to break-even.
Building this into a routine takes three steps:
- Log every bet with the line, the book, the time placed, and the closing number at tip.
- Calculate CLV as the difference between your number and the close, expressed in implied probability, and track it by prop category over time.
- Rotate books deliberately rather than hammering the same line at the same book repeatedly, which draws limits faster than almost anything else you can do.
Spreading action across several sportsbooks, checking each one before placing a stake, and avoiding oversized bets relative to a book’s limits all reduce the odds of getting flagged while giving you the best number available on any given night.
A Three-Block Nightly Routine That Captures Real Edges
A repeatable structure beats an ad hoc scroll through Twitter every night. Breaking the slate into three blocks reduces decision fatigue and, more importantly, makes sure you’re actually in position when the market moves.
Block one happens before lines post. Update your rotation notes, check for early injury designations, and flag two or three candidates where your minutes projection is likely to diverge from wherever the market will land. This is prep work, not betting.
Block two starts the moment lines go up. Compare your pre-built projections against the posted numbers immediately. Books set opening lines algorithmically in many cases, and early mispricing on secondary props (rebounds, assists, threes) tends to get corrected within an hour as sharp money comes in. This is often the best window for value on lower-liquidity markets.
- Filter for gaps that clear your EV threshold, not every gap you notice.
- Prioritize markets where you have a specific, defensible reason for disagreeing with the number.
- Skip anything where the discrepancy is inside normal market noise.
Block three covers the final 90 minutes before tip. This is when confirmed injury news lands, starting lineups get reported, and late line movement tells you what sharp money already knows. A short, repeatable three-block workflow like this is specifically designed to catch that late-information edge before the market fully absorbs it.
Budget your time accordingly: heavier prep during block one, fast execution during block two, and quick, decisive confirmation checks during block three. Trying to deep-research a new angle 20 minutes before tip is how good routines fall apart.
Turning Projections Into Numbers: Formulas and Thresholds
The core formula is straightforward: projected points = minutes × (usage rate × pace factor) × true shooting adjustment. Each piece pulls from the five-input loop, but writing it out as a formula forces discipline instead of gut-feel rounding.
Start with a per-minute production rate calculated from recent games on similar rest, then multiply by your projected minutes. Adjust that raw number using a true shooting differential against the specific opponent. A player facing a defense that allows true shooting 3 points above league average should see his baseline nudged up; a top-five defense pulls it down. Pace works as a multiplier on the whole projection: a game projected at 104 possessions per team scales differently than one projected at 96.
A worked example makes this concrete. If the market number sits at 17.5, that gap clears most reasonable EV thresholds for a high-liquidity market like points.
| Market liquidity | Typical prop examples | Rough EV threshold to act |
|---|---|---|
| High liquidity | Points, combined points | Smaller edge needed, tighter margins |
| Medium liquidity | Rebounds, assists | Moderate edge required |
| Low liquidity | Blocks, steals, alt lines | Larger edge required to offset wider vig |
Thinner markets demand a bigger projected gap before they’re worth a stake, because the vig baked into low-liquidity lines eats into smaller edges faster than it does on points or combined totals.
Covariance, Same-Game Parlays, and Market Traps
Combining player props into a same-game parlay changes the math in ways that trip up even experienced bettors. Two legs that look independent (a guard’s assist total and his team’s point total) often move together, because more assists usually means the offense is clicking, which usually means more points. Multiplying the individual odds as though the legs were independent overstates your actual edge.
Modeling covariance means looking at historical teammate-usage transfer patterns: how often do shots and minutes move to a specific player when a teammate is out or struggling? That data tells you whether a combined bet is genuinely additive or just double-dipping on the same underlying outcome.
- Correlated legs (a player prop plus his team’s total) usually offer worse true odds than the combined price suggests.
- Alt lines and low-volume markets (deep rebound alternates, obscure combo props) often carry wider hold and thinner liquidity than the interface suggests.
- Spreading stakes across multiple books, rather than repeatedly hitting the same book with the same type of bet, helps preserve account standing over a full season.
Pro Tip: Before placing a same-game parlay, ask whether the second leg would still hit if the first leg missed. If the answer is “probably not,” you’re not diversifying, you’re stacking the same bet twice.
Tools and Data Sources Worth Trusting
Not every data source deserves equal weight. The official NBA injury report is the single most authoritative source for availability, updated daily throughout the season, and it should be the first thing you check before locking any prop. Play-by-play and box-score providers fill in the historical data needed for minutes and usage trends.
Paid data feeds vary widely in latency and coverage; some update box scores within seconds of a game ending, others lag by hours, so confirm update speed before building a routine around any single source.
Where a platform like Parlaygeeks fits into this workflow:
- Real-time odds comparison across multiple sportsbooks for faster line shopping.
- Injury updates surfaced alongside the props they affect.
- Shareable BetSlips for tracking and comparing bets against the closing line.
- Educational resources covering bankroll management and betting strategy fundamentals.
Cross-checking public commentary, including expert prop pick columns, can help you gauge market sentiment, though it should never replace your own projection work.
Beating Your Own Brain: Bias Traps in Prop Betting
The biggest threat to a disciplined prop strategy usually isn’t bad data. It’s the bettor’s own head. Recency bias is the most common trap: a player drops 35 points and suddenly every prop bettor on the internet assumes that’s his new baseline, when it’s really a two-standard-deviation outlier against a bad defense.
Confirmation bias runs a close second. Once you’ve built a projection and like a number, it’s tempting to keep hunting for reasons it’s right instead of stress-testing it against the reasons it might be wrong. Force yourself to write down the strongest argument against your own bet before placing it.
Loss-chasing is where bankrolls actually die. A rough night on player props leads to bigger stakes on flimsier gaps the next night, chasing the previous loss instead of waiting for a genuine edge to reappear. Treat every night as independent from the last, because in terms of the math, it is.
Anchoring shows up constantly with lines themselves. If a book posts a number that feels “off” from what you expected, it’s easy to assume the number is wrong rather than questioning your own projection first. Sometimes the market knows something you don’t, like a lineup change that hasn’t hit the news yet.
The fix for all of these is procedural, not willpower-based: stick to the five-input loop, write projections down before checking the market number, and only bet when the gap clears a pre-set threshold you decided on before you had a stake in the outcome.
Where Machine Learning Fits Into Prop Projections
Statistical models have moved well past simple season averages, and the gap between casual and advanced bettors increasingly comes down to who’s using better inputs. The injury-risk research from Wharton is a good example of what’s possible: a Random Forest model trained on over a decade of injury logs found that workload variables like change in minutes and days since last injury outrank almost everything else in predicting next-game injury risk.
You don’t need to build a Random Forest model yourself to benefit from this thinking. The practical version is a formula: expected minutes equal (1 minus the probability a player sits) multiplied by his baseline minutes, plus that probability multiplied by his likely replacement’s minutes.
Regression-based models for usage and efficiency work similarly: they’re just formalized versions of the trailing-window weighting already covered in the minutes section, run at scale across every player on a slate instead of one at a time. The advantage isn’t magic prediction. It’s consistency, applying the same weighting logic to 200 players a night instead of the five you have time to research by hand.
Points, Rebounds, and Assists Each Need Their Own Approach
Treating every prop market the same way is a common mistake. Points props track closest to a player’s overall shot volume and efficiency, making them the most liquid and the hardest to find soft numbers on, since sportsbooks dedicate the most resources to pricing them accurately.
Rebounds behave differently because they’re heavily matchup-dependent in a way points aren’t. A center’s rebound total swings hard based on the opponent’s offensive rebounding rate and pace, and thinner markets here mean pricing errors linger longer before getting corrected.
Assists correlate tightly with a team’s offensive system and a point guard’s specific role rather than raw minutes alone. A ball-dominant guard traded to a slower, more egalitarian offense can see his assist number drop even if his minutes stay flat, which is exactly the kind of role shift that a pure minutes-based model misses.
Threes made carries its own variance because it depends on both shot volume and a hit rate that fluctuates game to game more than any counting stat. Combo props (points plus rebounds plus assists) smooth some of that individual volatility but require getting all three underlying projections right simultaneously, which raises the bar for confidence before betting them.
How Blowouts and Close Games Change Prop Outcomes
Game script is an underrated variable that most bettors only think about after the fact, when they’re wondering why their star’s rebounds prop missed despite a decent shooting night. Blowouts pull starters in the fourth quarter and sometimes the third, capping counting stats regardless of how efficient a player was while he was on the floor.
Close games do the opposite: stars play heavier minutes down the stretch, and usage often spikes further as the offense funnels through its best options in crunch time. A player projected for 30 points based on his season role might see that number pushed higher in a game your model projects as tight, and lower in one flagged as a likely rout.
Building this into your projection means checking the pregame spread alongside your minutes work. A double-digit spread should nudge your minutes projection down for star players on both teams, since coaches on the winning side rest starters and coaches on the losing side often do the same once the game is out of reach. A tight spread, by contrast, supports full expected minutes and can justify a slightly higher usage projection for closers.
This is also where role players benefit unpredictably. Bench players in blowouts often see extended fourth-quarter minutes, which can push their production well past normal expectations, an inefficiency worth watching for on cheap alt-line props specifically in games your model already flags as lopsided.
Reading Public Betting Trends Without Following Them Blindly
Public money moves prop lines in predictable, exploitable ways. Star players with national name recognition draw heavier public betting volume than role players, which means their lines often carry more inherent inefficiency, either too generous or too tight depending on which side the public is leaning.
A useful habit is watching which way a line moves relative to where the public percentage sits.
Contrarian betting isn’t about automatically fading the public. It’s about noticing when public perception and your own projection diverge, then double-checking your work before deciding which one to trust. Sometimes the public is right because a star genuinely is heating up. Sometimes the public is chasing last week’s box score.
Cross-referencing editorial prop picks alongside line movement data gives you a rough read on public sentiment without requiring proprietary betting-percentage data most casual bettors don’t have access to. Use it as one more input, not a deciding factor on its own.
Adjusting Player Props in Real Time During Games
Live prop betting rewards bettors who’ve already done their pregame homework, because there’s no time to build a projection from scratch once the ball is in the air. The advantage goes to whoever can update an existing number fastest, not whoever can build one fastest.
Track pace and foul trouble as the two fastest-moving variables during a live game. A player picking up two early fouls changes his realistic minutes ceiling immediately, and live books often lag slightly in adjusting his in-game props accordingly. Similarly, a game running well above or below its pregame pace projection should shift your in-game read on remaining counting-stat opportunities for every player still on the floor.
Halftime is the single best live window for props tied to second-half production specifically, since you now have a full half of actual pace, foul, and usage data instead of a pregame estimate. A star who’s been quiet in the first half due to foul trouble or a slow shooting start, but who still projects for full second-half minutes, often gets live pricing that hasn’t fully caught up.
Keep live stakes smaller than pregame stakes as a rule. The information edge is real, but so is the speed disadvantage most bettors face against books that update lines algorithmically within seconds of a live event.
How Roy Applies This Routine Across a Full Season
Volume without accuracy just multiplies your losses faster, so I track fewer props more carefully rather than betting every slate top to bottom. CLV logged by market category tells me where my edge actually lives each season, and staking small enough to survive variance is what keeps the account open long enough for that edge to show up.
— Fogell
Run This Routine Faster With Parlaygeeks
Building a five-input projection loop by hand, then line-shopping it across five sportsbooks before tip, takes real time on a busy slate. Parlaygeeks compresses that into one screen: real-time odds comparison across multiple books, injury updates surfaced next to the props they affect, and shareable BetSlips that make CLV tracking a habit instead of a chore.
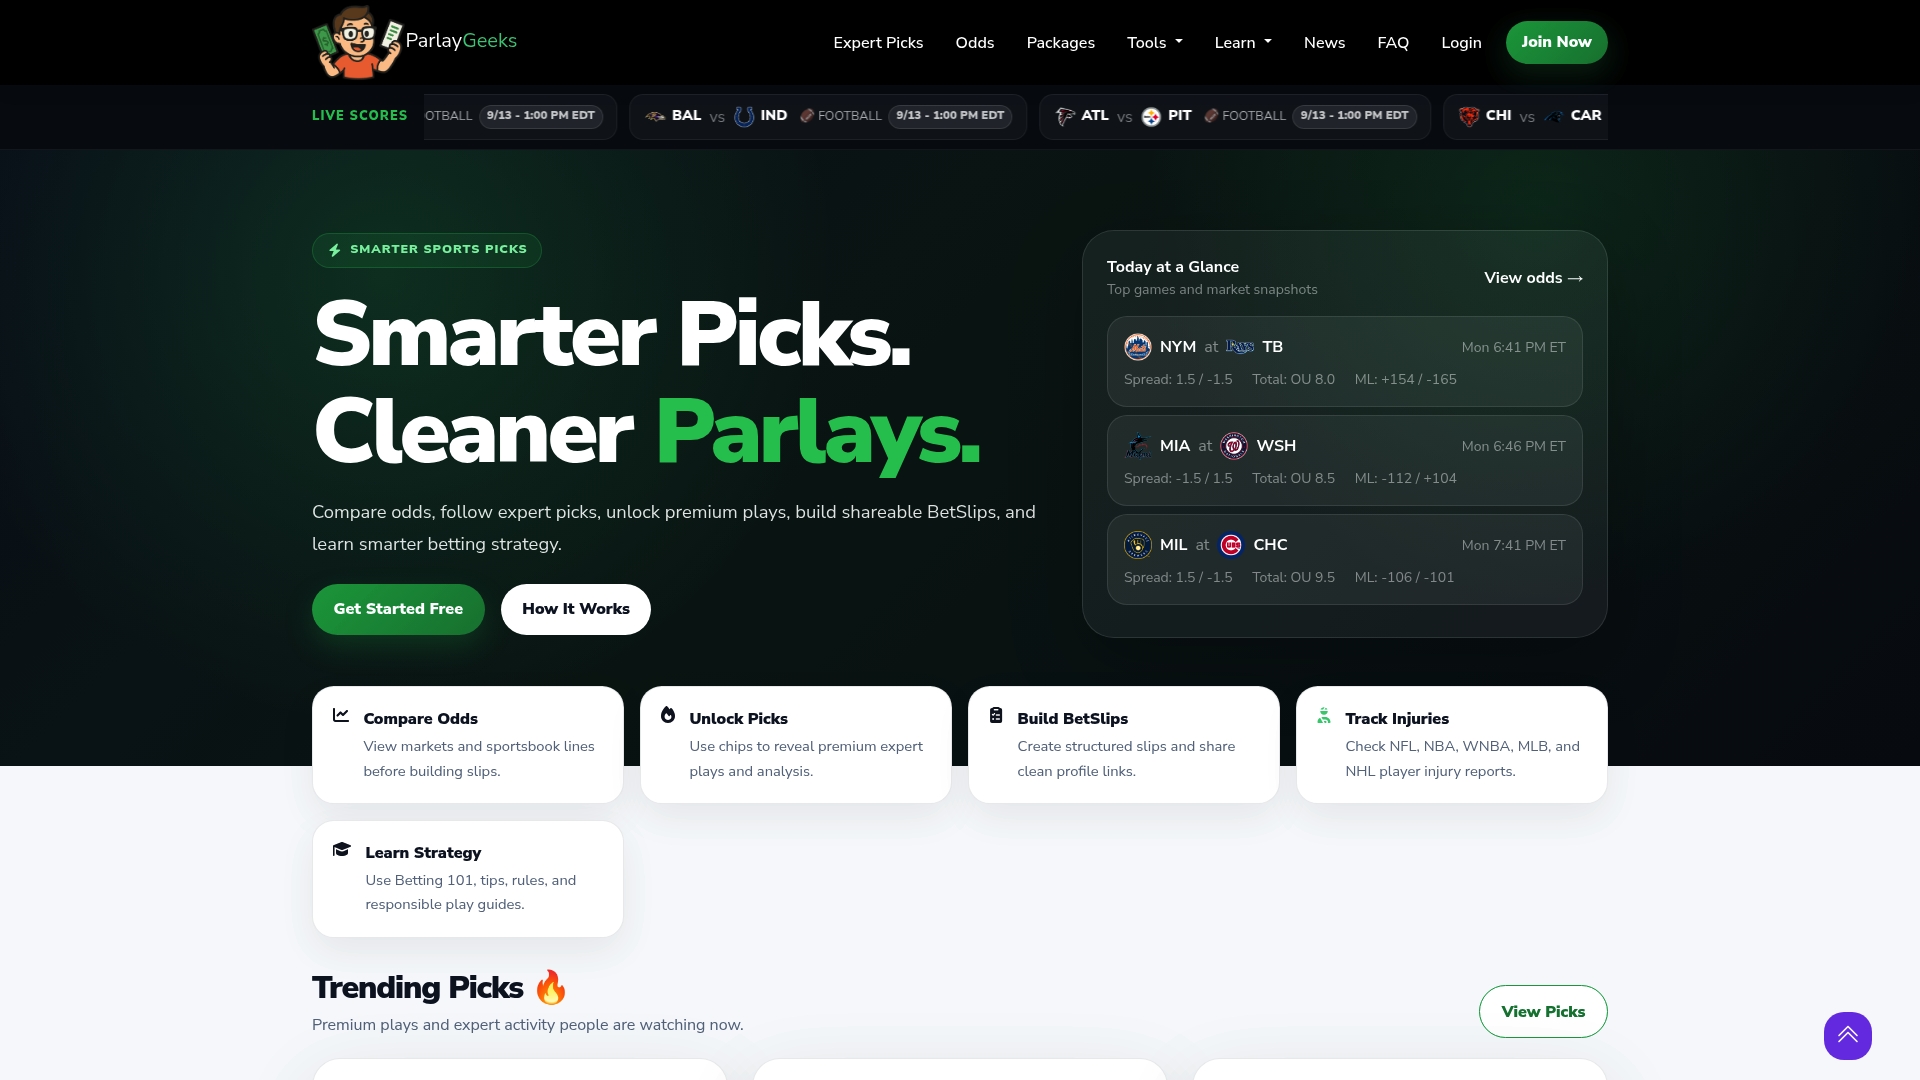
The platform’s premium tiers unlock expert picks with transparent reasoning behind each one, so you can compare your own projection against a second opinion before staking. Silver runs $49 per month, Gold sits at $99 per month, and Platinum is $199 per month, all through the Parlaygeeks premium plans page. If you’d rather start with the free tools first, the core platform covers odds comparison and BetSlip building at no cost. Either way, the next step is the same one covered in the nightly routine above: check tonight’s injury report, build your projection, and see where the market disagrees with you.
Sources
- NBA Player Participation Policy
- Using injury-risk forecasting to quantify financial impact in the NBA (Wharton)
FAQ
What Are the Best Prop Bets to Target?
The strongest prop bets are the ones where your minutes-and-usage projection diverges meaningfully from the market number, not any single fixed category. Points props tend to be the most efficiently priced because of high liquidity, while thinner markets like rebounds and blocks carry more pricing errors worth hunting for, per market structure analysis.
Can AI Predict Basketball Outcomes?
Machine learning models can meaningfully predict specific inputs, like next-game injury risk, using variables such as change in minutes and days since last injury, according to Wharton research. Predicting a full game outcome or exact prop result is far less reliable, since it involves far more variables than injury forecasting alone.
How Do I Find the Best NBA Props Tonight?
Run tonight’s slate through the five-input loop (minutes, usage, efficiency, matchup, pace), then flag any player where your number clears the market line by a meaningful margin. Checking the official injury report first and line-shopping across several sportsbooks, a routine Parlaygeeks is built to speed up, narrows the list to your highest-conviction plays.
How Can I See Which Player Props the Public Is Betting Most?
Betting percentage data isn’t always public, but line movement is a reasonable proxy: if a line barely moves despite one side taking most of the tickets, that usually signals sharp money on the other side. Editorial prop pick columns can also hint at where public attention is concentrated on a given night.