
Find Sharp Money Fast: 3 Real Time Checks for Public Betting Data
Public betting data shows the share of tickets (Bets %) and the share of money (Handle %) landing on each side of a game. The gap between those two numbers tells you where the crowd is betting versus where the real money is going. When they diverge sharply, that gap is often the clearest signal you’ll get before kickoff, and everything below shows you how to read it correctly.
TL;DR:
- A sharp signal is indicated when a minority of tickets carries more than half of the handle, showing professional or high-stakes betting against public sentiment.
- Divergences of 15 or more points between Bets % and Handle % at different times reveal when sharp money influences line movement despite public betting patterns.
- Monitoring splits at three key intervals — after lines open, midweek, and the final hour — helps determine the true market consensus and sharp actions.
- Analyzing both Bets % and Handle % together is essential, as handle usually has more weight, especially when heavy handle accompanies a ticket minority.
- Relying solely on splits is risky; they are most effective when combined with injury reports, line history, and personal handicapping models for better betting decisions.
Table of Contents
- What Public Betting Data Actually Measures
- Reading Sharp Signals vs Public Signals
- When to Check Splits and What Line Movement Tells You
- Choosing a Real-Time Public Betting Data Source
- How ParlayGeeks Uses Public Betting Data in Practice
- Why Splits Help and Where They Fall Short
- Get Real-Time Splits and Sharper Picks in One Place
- Sources
- FAQ
What Public Betting Data Actually Measures
Two numbers drive every splits table you’ll ever look at: Bets % and Handle %. Bets % is ticket share, the raw percentage of individual wagers placed on a side. Handle % is money share, the percentage of total dollars wagered on that side. They sound similar. They rarely match, and the distance between them is the entire point of tracking betting splits in the first place.
That’s a textbook signature of sharp action working against public sentiment.
- Bets %: how many people bet a side, regardless of stake size
- Handle %: how much money is riding on that side, which weighs bigger bets more heavily
- Spread and total markets tend to show the widest bets/handle gaps because public bettors gravitate toward favorites and overs.
- Moneyline splits often run closer together since bettors backing dogs need less capital to make an impact on ticket count
Pro Tip: *Never read Bets % alone.
You need both numbers because either one in isolation lies to you. Ticket share alone tells you what the public likes. Handle share alone tells you where the money sits, but without ticket context you can’t tell if that money came from one whale or a thousand casual bettors agreeing with the crowd.
Reading Sharp Signals vs Public Signals
A “sharp” signal looks like a minority of tickets carrying a majority of the handle. Think 30% of bets accounting for 55% of the money. That imbalance usually means professional or high-stake bettors are concentrated on one side while the general public sits on the other.
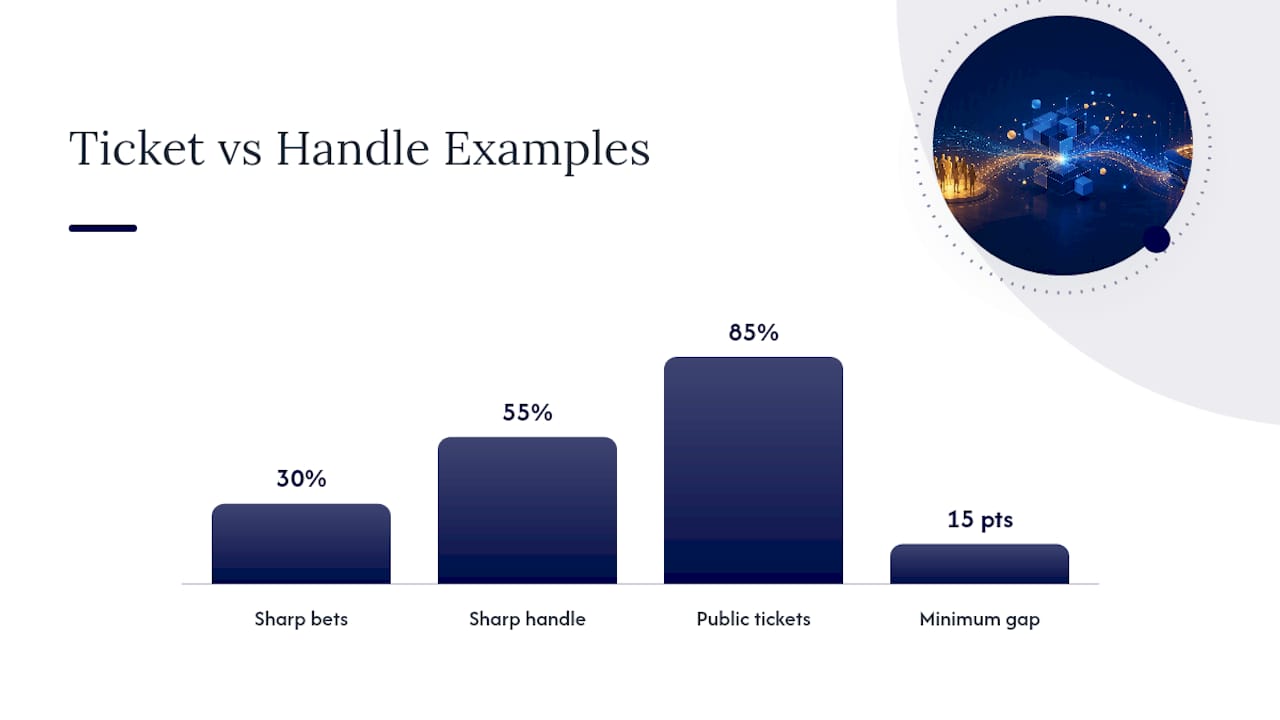
A “public” signal is the mirror image: a heavy majority of tickets with a proportionally low handle share. That’s recreational money spread thin across a popular side, the kind of action sportsbooks are often happy to take because they’ve priced it to profit from volume alone.
Here’s how experienced bettors turn that distinction into action:
- Identify the divergence first. Pull up the splits and look for any gap of 15 points or more between Bets % and Handle %.
- Follow heavy handle on a ticket minority. When 25 to 35% of bets carry 50%+ of the handle, that’s usually sharp money worth respecting.
- Fade extreme ticket-majorities only with confirmation. Don’t fade a side just because 85% of the public is on it. Wait for the line to move against that majority before treating it as a fade signal.
- Cross-check with line movement. A split without a corresponding line move is often noise, not signal.
- Recheck closer to kickoff. Splits shift as the week progresses, and a Tuesday snapshot rarely matches Sunday morning.
The most common mistake bettors make is checking splits once, early in the week, and locking in a read that’s stale by game day. The second most common mistake: acting on a lopsided ticket count with no idea whether the line has actually moved. Sportsbooks routinely let public money pile up on a side without adjusting the number at all, especially on marquee games where volume alone won’t move them.
When to Check Splits and What Line Movement Tells You
Timing changes what the data means. Checking splits at the wrong moment gives you a distorted read, so experienced bettors monitor at three specific windows rather than glancing once and moving on.
The first check happens right after lines open, when the market is thin and early sharp money has the most room to move a number before public volume floods in. The second comes midweek, once injury news, weather forecasts, and public sentiment start pushing tickets toward one side. The third and most important check is the final hour before kickoff, when late sharp action and steam moves show up and the book has priced in nearly everything it’s going to see.
Line movement relative to ticket share is where the real story lives. But if that same 80% ticket-majority sees the line move against it, that’s a strong indicator that sharp, high-dollar bets are pushing the number despite being outnumbered in raw bet count.
- Open: establishes baseline, catches the earliest sharp positioning
- Midweek: reflects news-driven shifts and growing public volume
- Final hour: captures steam moves and late sharp confirmation
Statistic Callout: U.S. bettors legally wagered $165.58 billion in 2025, generating $16.80 billion in operator revenue. That volume means lines move constantly, and a snapshot from Tuesday can be meaningless by Saturday.
A decision checklist worth memorizing: act when a ticket minority carries heavy handle and the line has moved toward that minority’s side. Hold off when the split shows no line reaction at all. That combination filters out most of the false signals casual bettors chase.
Choosing a Real-Time Public Betting Data Source
Not every splits feed is built the same way, and the features that matter most rarely show up in the marketing copy. Look for a provider that discloses Bets % and Handle % side by side, covers spread, total, and moneyline markets, and refreshes often enough to catch same-day movement.
Update cadence matters more than most bettors realize. VSiN’s betting-splits data refreshes every five minutes and states plainly that its numbers derive from DraftKings action, a level of transparency that lets you weigh the data appropriately instead of guessing where it came from.
- Refresh rate: aim for a 5 to 15 minute cycle; anything slower risks missing late sharp money
- Market breadth: confirm coverage across spread, total, and moneyline, not just one market
- Line-movement overlay: a feed showing splits without the corresponding line move forces you to hunt for context elsewhere
- Historical snapshots: archive access lets you compare current splits to past weeks for the same team or matchup
- Source disclosure: know which sportsbook’s action the splits represent, since one book’s public money can skew differently than another’s
Free tools typically give you a live snapshot with no archive and limited alerting. Paid tiers usually add historical data, custom alerts, and broader market coverage, which matters if you’re tracking multiple games across a full slate rather than one Sunday feature.
How ParlayGeeks Uses Public Betting Data in Practice
Three workflows show up again and again among sharper bettors. First, a quick-check fade scan: heavy ticket-majority with thin handle and no line movement often signals public money the book is comfortable taking. Second, pregame sharp-detection: watching for minority-handle inflows paired with a line move confirms professional positioning. Third, parlay construction: using splits to spot correlated legs and avoid stacking multiple public-heavy sides into one slip, which compounds risk rather than diversifying it.
Pro Tip: Before locking a multi-leg parlay, check the splits on each individual leg separately. If three of your four legs are all heavy public plays with no sharp confirmation, you’ve built a parlay on crowd sentiment, not on edge.
Why Splits Help and Where They Fall Short
Public betting data earns its place in a real handicapping process, but it isn’t a standalone strategy. The most disciplined approach treats splits as one input among several, combined with injury reports, recent line history, and your own model or handicap. A wide bets/handle divergence is meaningful. A divergence with no corroborating line move or context is often just noise dressed up as signal.
Splits work best for bettors who check them at multiple points in the week, not once. They mislead bettors who treat a single number as gospel or who ignore the fact that sportsbooks sometimes let public money accumulate without moving a line at all. Bet within your means, track your results honestly, and treat any data source, splits included, as a tool for better decisions rather than a guarantee of them.
— Thelma
Get Real-Time Splits and Sharper Picks in One Place
Parlaygeeks gives you the pieces this article just walked through, without stitching together three separate tabs to see them. Odds comparison across multiple sportsbooks allows you to spot line moves as they happen.
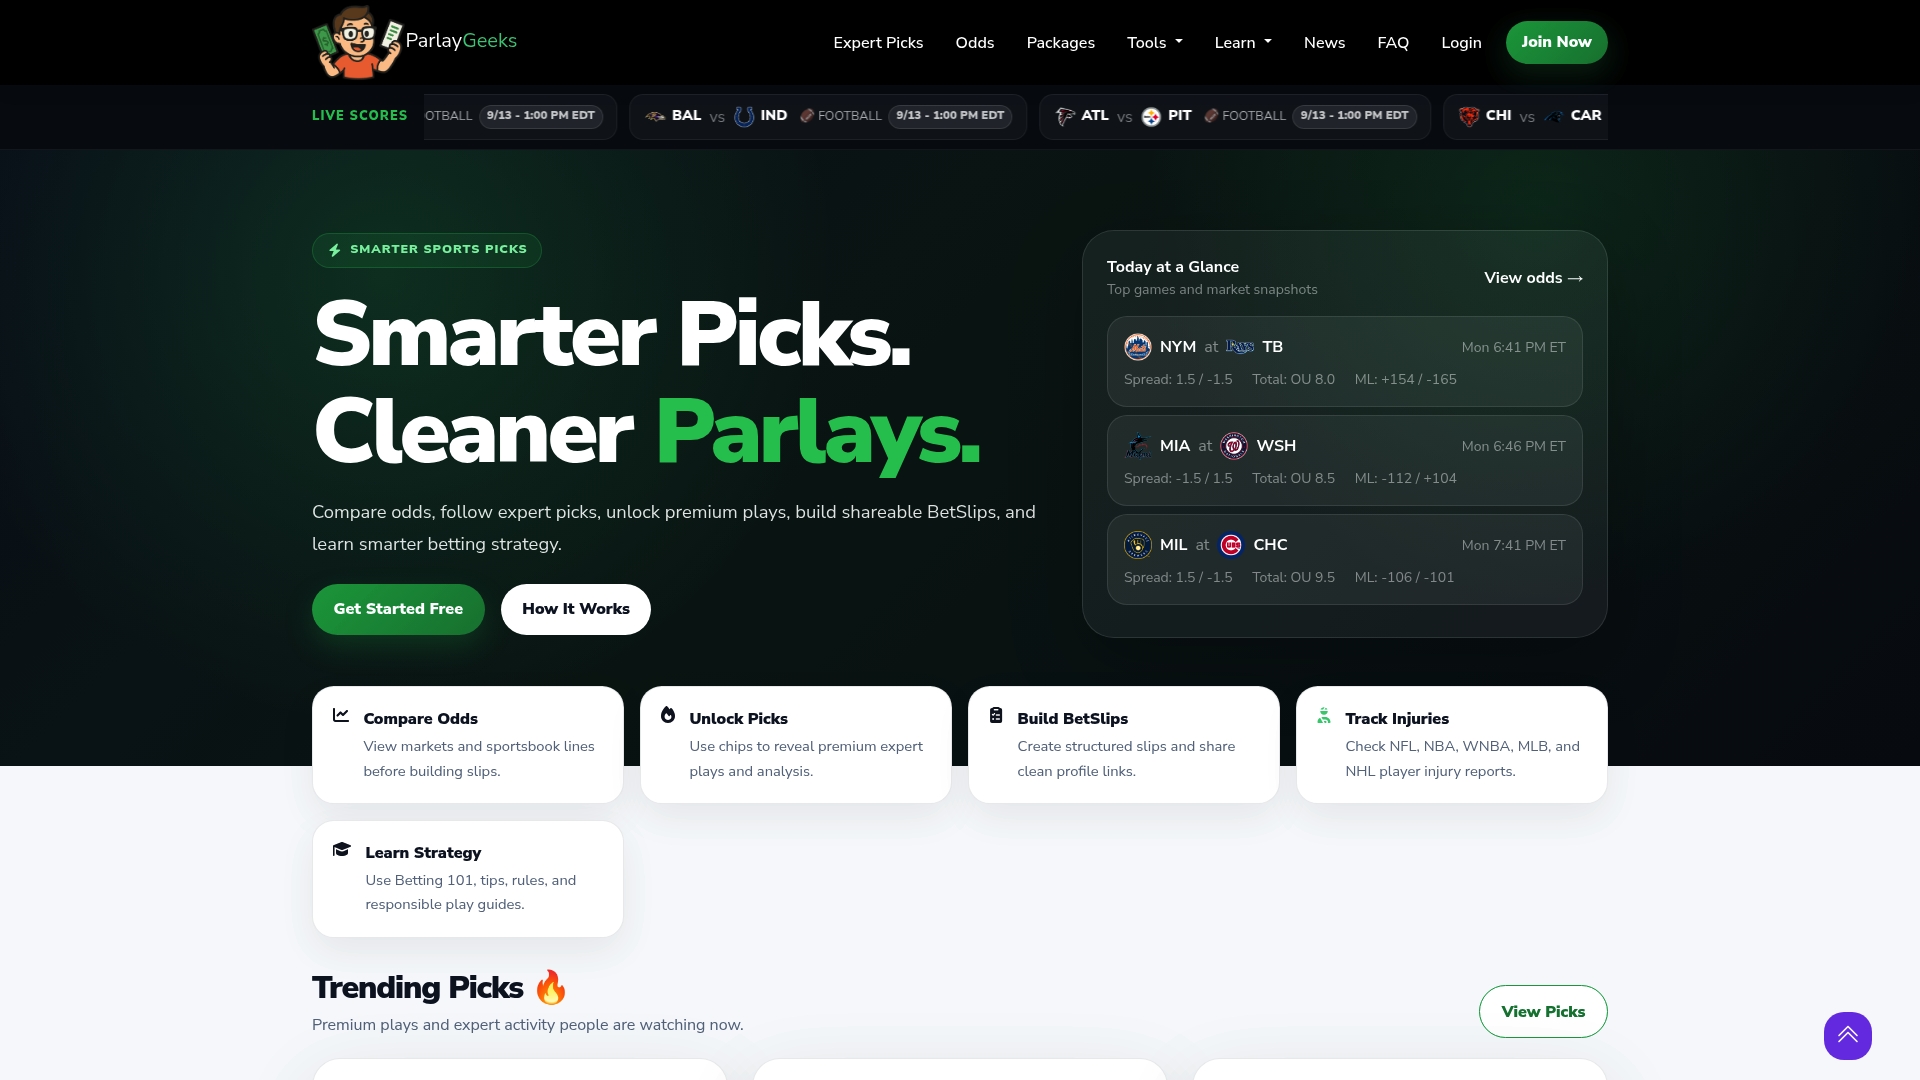
Some platforms offer expert picks and analysis, plus shareable BetSlips to compare parlay construction against other bettors. You can follow expert profiles, check injury updates, and use a parlay calculator before committing to a multi-leg slip. If the three workflows above sound like something you want built into your routine instead of assembled by hand every week, start with ParlayGeeks and see how the pieces fit together on your next slate.
Sources
For live splits tables, VSiN’s betting-splits page updates continuously and discloses its sportsbook source. For market-wide context, Statista and the American Gaming Association’s revenue tracker cover handle and revenue trends at the state level.
- Betting Splits - VSiN
- VSiN - Betting Splits
- Sports Betting Statistics 2026: Handle, Tax, and Market Data - Axis Intelligence
FAQ
How Do You Interpret Public Betting Data?
Compare Bets % to Handle %. A wide gap, especially a ticket minority carrying heavy handle, usually points to sharp money on that side, while a matching gap with no line movement is often just noise.
Which App Is Best for Analyzing Betting Statistics?
Look for a platform that shows both Bets % and Handle % together, refreshes every 5 to 15 minutes, and discloses its sportsbook source. Parlaygeeks combines real-time odds comparison with expert picks so you’re not checking multiple tabs to build a full picture.
Is Public Betting Data Reliable on Its Own?
No single split guarantees an outcome. Treat it as one input alongside line movement, injury reports, and your own handicap, not as a standalone betting strategy.
Why Do Bets % and Handle % Sometimes Move in Opposite Directions?
Because ticket count reflects how many people bet a side while handle reflects how much money is behind it. A few large sharp wagers can outweigh thousands of small public bets in dollar terms without ever showing up as a ticket majority.
How Often Should I Check Betting Splits Before a Game?
At minimum, check at three points: right after the line opens, again midweek as news and injury updates land, and once more in the final hour before kickoff when late sharp money typically shows up.