

Make Sports Betting Models Pay: Calibrate, Walk Forward, Beat the Close
Yes. Properly built and calibrated sports betting models can produce a real edge in specific markets, but calibration and honest backtesting matter far more than headline accuracy. Models tend to work best in totals, player props, and other markets the big books price less aggressively. They tend to fail against closing lines in heavily bet markets unless you bring your own information edge, disciplined walk-forward testing, and fractional Kelly staking.
TL;DR:
- Models work best in markets like totals and player props, where bookmakers price less aggressively and sharp lines can be exploited without overbetting.
- Proper calibration of probabilities consistently outperforms raw accuracy, as trustworthy confidence levels are critical for effective staking and long-term profit.
- Walk-forward backtesting offers a more reliable performance estimate than static cross-validation, especially when evaluating model stability across seasons and market conditions.
- Fractional Kelly staking, combined with capped bet sizes and stop-loss limits, significantly reduces variance and protects long-term bankroll health.
- Data pipelines should be automated and timestamped, with regular updates on injuries, lines, and key features, to avoid future information leaks and ensure model integrity.
Table of Contents
- How Sports Betting Models Work: An Overview of the Main Types
- What Data and Features Actually Move the Needle
- Why Calibration Beats Accuracy in Betting Models
- How to Backtest and Report Betting Model Performance
- Bankroll Rules That Actually Protect You From Variance
- Building a Production Workflow for Your Betting Model
- Common Pitfalls and Biases in Sports Betting Modeling
- Understanding Betting Odds and Why Markets Are Hard to Beat
- What I’ve Learned Building and Watching Betting Models Fail
- Put Your Model’s Edge to Work With Parlaygeeks
- Sources
- FAQ
How Sports Betting Models Work: An Overview of the Main Types
Most sports betting models fall into a handful of families, and picking the right one depends on the market, the data you have, and how much you need to explain your own predictions.
- Regression models (Poisson, negative binomial): still the default for totals and team scoring, because scoring in most sports behaves like a count process.
- Logistic regression: a workhorse for moneyline and spread classification, especially when you have a small, well-understood feature set.
- Tree ensembles like LightGBM and XGBoost: handle messy, tabular data with interactions well and usually outperform linear models once you have more than a dozen engineered features.
- Neural networks: worth the added complexity mainly for sequential or high-dimensional inputs, like play-by-play sequences or player tracking data, where hand-built features would miss structure.
- Monte Carlo simulation: useful for joint outcomes, such as simulating an entire game to price parlays or correlated player props.
Ensembles tend to beat single models when you have enough data and enough distinct feature signals to make blending worthwhile. Simple models still win when data is scarce, features are limited, or you need to explain exactly why a pick was made. Whatever architecture you land on, research comparing model selection criteria in sports betting found that calibrating outputs after training, rather than chasing raw accuracy during training, is what actually moves long-run betting performance.
What Data and Features Actually Move the Needle
The market itself is a feature. De-vigged implied probabilities, and how a line moves from open to close, tell you what sharper money already believes. Treating the closing line as your benchmark, rather than an afterthought, is one of the fastest ways to find out if your model has real signal or is just repackaging public information.
Beyond the market, useful inputs usually include:
- Recent-form windows, weighted so a team’s last five games count more than its last twenty.
- Opponent-adjusted ratings, since raw scoring numbers mean little without accounting for who was on the other side.
- Player-level availability: injuries, load management, and bench depth.
- Rest and travel, particularly back-to-backs and time-zone shifts.
- Weather, for any outdoor sport where wind or precipitation affects scoring.
Feature engineering usually means converting raw counts into rates or per-possession numbers, applying opponent adjustments, building rolling averages, and testing interaction terms between, say, pace and defensive efficiency. None of it matters if your pipeline leaks future information into training data. Timestamp every ingested row, never let a feature reflect information unavailable at prediction time, and keep an append-only log of every prediction you make before the game starts.
Pro Tip: Build your morning data sync and retrain job before you build your first model. A pipeline that updates injuries and lines automatically at 9 a.m. will save you more edge over a season than any single feature you engineer by hand.
Why Calibration Beats Accuracy in Betting Models
A model that’s “76% accurate” sounds impressive until you realize accuracy says nothing about whether its 70% predictions actually hit 70% of the time. That gap is exactly what calibration measures: when a model says a team has a 65% chance to cover, does that outcome happen close to 65% of the time across every instance where it made that call? A reliability diagram plots predicted probability against observed frequency, and the closer that line sits to the diagonal, the more trustworthy your probabilities are for staking decisions.
Academic research on NBA betting simulations found that model selection based on calibration, rather than accuracy, increased simulated bettor wealth over time. Accuracy optimizes for correctness on average. Calibration optimizes for whether your confidence levels can be trusted, which is the only thing a staking formula actually cares about.
Practical calibration methods include:
- Isotonic regression: flexible, nonparametric, and generally the strongest choice with enough data.
- Platt scaling: a simple logistic fit on top of your raw scores, useful with smaller samples.
- Temperature scaling: common with neural network outputs to soften overconfident probabilities.
Apply these on out-of-fold predictions, never on the same data used to train the base model, or you’ll calibrate away real signal along with the noise. For production timelines, prefer walk-forward or out-of-time validation over standard cross-validation. It mimics how the model will actually be used, one week at a time, with no access to future information.
How to Backtest and Report Betting Model Performance
Static cross-validation flatters most models because it shuffles time around. Walk-forward backtesting doesn’t: you train on everything up to a date, predict forward, then roll the window ahead and repeat. It’s slower to run and less forgiving, which is exactly why it’s the only backtest worth trusting before you risk real money.
A credible performance report includes:
- Brier score and log-loss, not just win rate, since both penalize overconfident wrong calls harder than accuracy does.
- Per-confidence-tier win rates, so a 60% tier and an 80% tier get evaluated separately instead of blended into one misleading average.
- Closing-line value (CLV): whether your bets consistently beat the closing number, which is a stronger long-run signal than short-term win rate.
- Sample-size confidence intervals on every reported figure, because a 58% win rate on 40 bets means almost nothing.
One public example worth studying is the ShamgarBN mlb-bet-engine project on GitHub, which walk-forward backtested across over fifteen thousand MLB games from 2014 to 2025 and published per-tier results alongside calibration reporting rather than a single flattering headline number. Run a season post-mortem every year, sliced by market type, time of day, and venue, and watch for lookahead leakage and data snooping, the two errors most responsible for backtests that look great and bets that don’t.
Bankroll Rules That Actually Protect You From Variance
Even a genuinely edge-positive model loses often. The full Kelly formula sizes each bet based on your edge and the odds, but full Kelly assumes your probability estimate is exactly right, which it never is. That’s why most professionals use fractional Kelly instead.
- Start with quarter to half Kelly, not full Kelly, to reduce variance while keeping most of the long-run growth benefit.
- Cap any single bet at a fixed percentage of your total bankroll, regardless of how confident the model feels.
- Never increase your bet size after a win streak. Recalculate from your actual edge, not your recent mood.
- Set a stop-loss threshold that pauses betting and forces a review if your bankroll drops past a defined point.
Bankroll management guidance on player props consistently points to reduced Kelly fractions as the practical standard, precisely because variance, not edge, is what ends most betting careers early.
Pro Tip: Track profit and loss by confidence tier, not by headline win rate. A model that’s profitable in its 70%+ tier but bleeding money in its 55% tier is telling you exactly where to stop betting.
Building a Production Workflow for Your Betting Model
A model that lives in a notebook isn’t a system. It’s a one-time experiment. Turning it into something you can trust over a season means treating it like actual infrastructure.
- Data ingestion: pull lines, injuries, and box scores on a fixed schedule, timestamped on arrival.
- Feature store: transform raw data into the rates, rolling windows, and adjustments your model expects.
- Model training: fit on historical data, generate out-of-fold predictions for calibration.
- Calibration: apply isotonic regression or Platt scaling to the out-of-fold outputs.
- Walk-forward test: validate on a rolling out-of-time window that mirrors live conditions.
- Deploy predictions: publish picks through an API or a simple CSV export, never auto-place bets.
- Journal and monitor: log every prediction before the game, then review accuracy and calibration drift weekly.
Weekly retrains with validation checks, and an automated rollback if moneyline accuracy regresses past a set threshold, keep a live model from quietly decaying. If you’d rather validate your walk-forward results independently before trusting them, a tool like Backstedge lets you backtest a strategy outside your own pipeline. Archive a clear “model of record” for each season. When someone asks how last year’s picks were generated, you should be able to answer in one sentence, not a shrug.
Common Pitfalls and Biases in Sports Betting Modeling
Overfitting is the obvious trap: a model with too many features relative to its sample size will fit noise in your training data and fall apart the moment it sees a new season. Underfitting is the quieter one, where a model too simple to capture real structure produces mediocre results that never improve no matter how much data you feed it.

Survivorship bias creeps in when you only backtest markets or seasons where your approach happened to work, quietly ignoring the years it didn’t. Recency bias shows up when a model overweights a team’s last few games without accounting for schedule strength, leading to wild swings in confidence that don’t reflect reality. Confirmation bias is more human than statistical: bettors tend to remember the model’s wins vividly and rationalize away its losses, which makes an honest, unedited prediction journal the single best defense against fooling yourself.
Data snooping deserves special mention. If you test twenty feature combinations against the same holdout set and pick the best one, you’ve effectively trained on your test set without realizing it. The fix is boring but necessary: lock your validation window before you start experimenting, and resist the urge to “just check” performance on it while you’re still building.
Understanding Betting Odds and Why Markets Are Hard to Beat
Odds aren’t just a payout number. They’re a probability estimate wrapped in a built-in profit margin. Every line carries what’s known as the vig, or overround, the bookmaker’s margin baked into both sides of a bet. Line shopping to reduce the vig lowers your break-even win rate directly, which means the same predictive edge is worth more at one book than another purely because of pricing.
Market efficiency varies enormously by sport and bet type. Major markets like NFL point spreads and NBA moneylines attract enormous liquidity and sharp money fast, which pushes lines toward something close to a true probability within minutes of release. Niche markets, like second-half totals in college basketball or specific player prop combinations, get far less attention from sharp bettors and books alike, leaving more room for a model with better data or faster reaction time to find value.
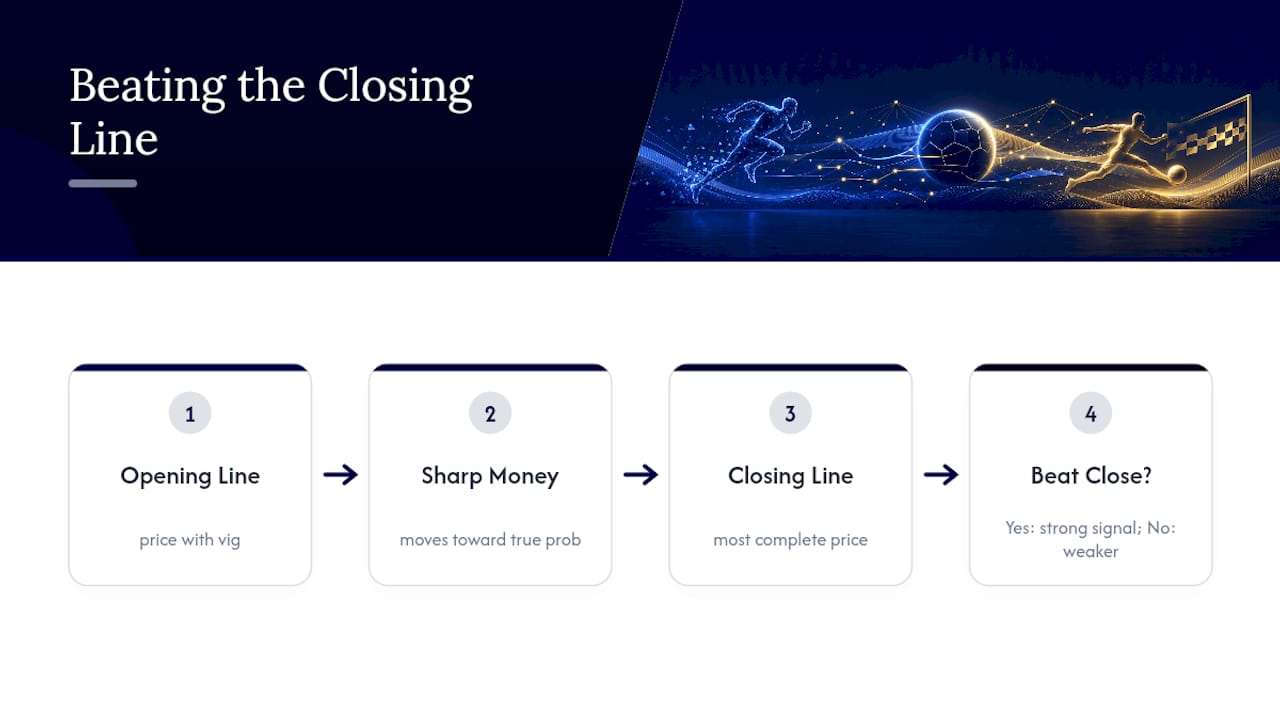
That’s also why closing-line value matters so much as a diagnostic. A book’s closing line usually reflects the most complete information available, since it absorbs sharp action right up to kickoff. If your model consistently beats the close, even on bets that individually lose, that’s a stronger signal of real predictive skill than a short-term win rate ever will be.
What I’ve Learned Building and Watching Betting Models Fail
The biggest misconception in this space is that a sports betting model needs to be sophisticated to be useful. It needs to be honest. A logistic regression with five well-chosen features and a rigorous walk-forward backtest will outperform a neural network trained on leaked data and validated on the wrong window, every single time. Complexity is not the same thing as edge, and I’ve seen more bettors get burned by an impressive-looking model with a broken validation process than by a simple one that was tested correctly.
The second thing people underestimate: markets punish overconfidence specifically, not just wrong predictions. That’s the entire argument for calibration over accuracy, and it’s why platforms and bettors who report performance by confidence tier tend to be the ones worth listening to.
Parlaygeeks exists in that same spirit: comparing odds across sportsbooks so a real edge isn’t quietly eaten by a bad price, and giving bettors a place to see how expert picks are reasoned through rather than just handed down as a number. Injury updates and shareable BetSlips don’t replace a model. They support one, by giving you the same market context a serious model needs to price things correctly.
— Elaine
Put Your Model’s Edge to Work With Parlaygeeks
A calibrated model is only as good as the price you get to bet it at. That’s the practical gap Parlaygeeks closes: real-time odds comparison across multiple sportsbooks means your model’s edge doesn’t quietly evaporate because you took a worse number than you had to, which matters more for closing-line value than most bettors realize.
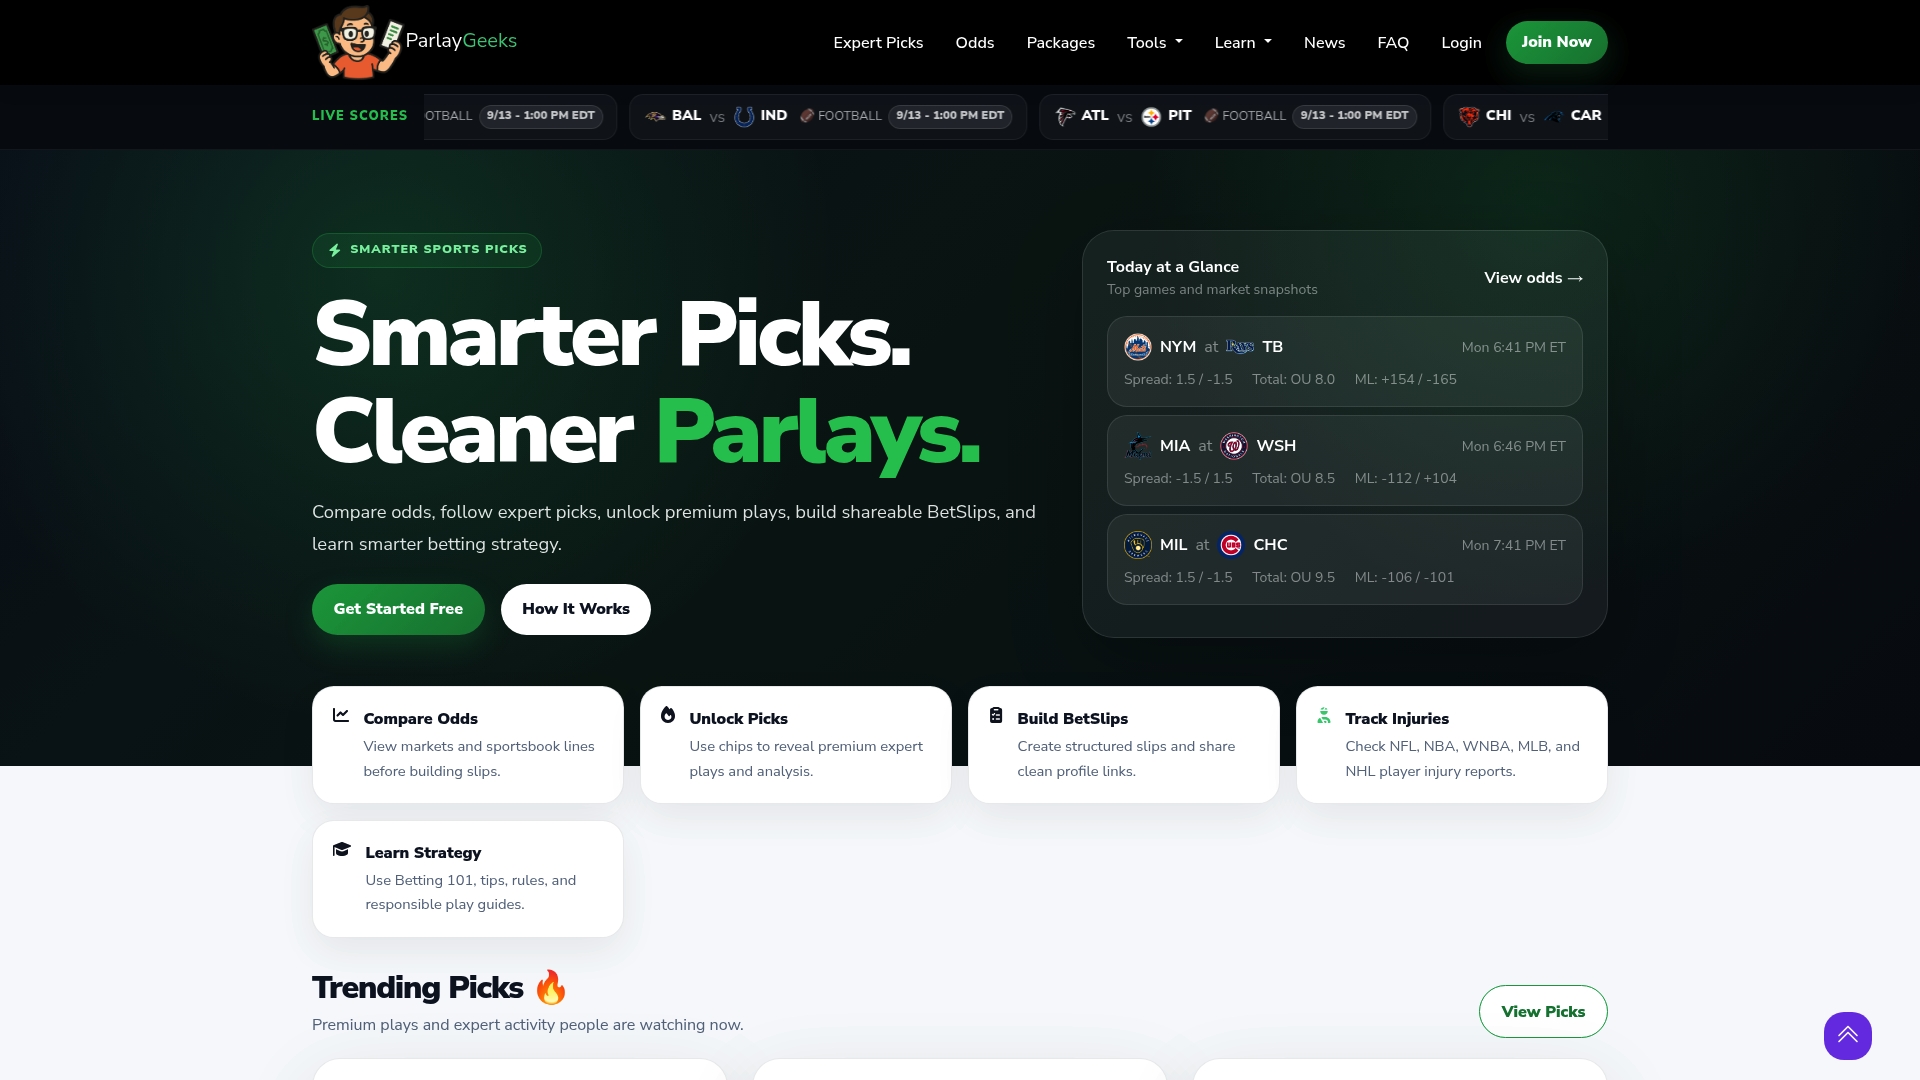
Beyond pricing, Parlaygeeks gives you tools that pair naturally with a model-driven approach: a free parlay calculator for checking correlated bets, a structured BetSlip builder for turning picks into something shareable and trackable, and expert analysis with transparent reasoning if you want a second opinion on markets your own model doesn’t cover yet. Follow experts, check injury updates before you finalize a stake, and lean on the educational resources if you’re still refining your bankroll rules.
If you want deeper access, expert picks, and enhanced betting tools, the Silver, Gold, and Platinum plans start at $49 per month. Otherwise, start free by exploring Parlaygeeks and comparing today’s lines before your next bet.
Sources
- Machine learning for sports betting: Should model selection be based on accuracy or calibration?
- ShamgarBN/mlb-bet-engine
- Variance and bankroll management for player props — Wizard of Odds
- What is the vig — Fox Sports
FAQ
What Is the Best Model for Sports Betting?
There’s no single best model. Poisson regression tends to fit totals well, tree ensembles like LightGBM handle complex tabular features, and simpler logistic models often win when data is limited. What matters more than the algorithm is whether its output is properly calibrated before you use it to size bets.
How Do I Build a Sports Betting Model From Scratch?
Start with clean, timestamped historical data, engineer features like opponent-adjusted ratings and recent-form windows, then train a model and calibrate its outputs using isotonic regression or Platt scaling. Validate everything with a walk-forward backtest, not standard cross-validation, since it mirrors how the model performs in live conditions.
Can I Get a Free Sports Betting Model?
Public projects like ShamgarBN’s mlb-bet-engine publish open-source code with documented backtests you can study or adapt. Parlaygeeks also offers free tools, including a parlay calculator and expert pick previews, that support your own model-building process without a subscription.
Is It Realistic to Make $100 a Day Sports Betting?
It depends entirely on bankroll size and staking discipline, not on wanting a fixed daily number. A model with a genuine edge sized using fractional Kelly can grow a bankroll over a season, but targeting a fixed daily dollar amount tends to push bettors into oversized bets that wreck long-run variance.